Use Case
Automated XPS Data Analysis Case Study [AutoStatSpectra]
Objectively determines the number of peaks and achieves stable fitting without initial-value dependency. Compared with the conventional Levenberg-Marquardt (LM) method, this approach produced more appropriate results.
Overview
X-ray Photoelectron Spectroscopy (XPS) data analysis has traditionally required analyst experience and judgment for both determining the number of peaks and fitting model parameters. Our automated spectral analysis software AutoStatSpectra uses Bayesian inference to objectively estimate the number of peaks and deliver stable parameter estimation with reduced initial-value dependency.
Benefits
- Objectively determines the number of peaks based on posterior probabilities
- Ensures reproducibility through parameter estimation without initial-value dependency
- Quantifies parameter uncertainty as posterior distributions

Three Advantages of This Approach
We compared the key results of Bayesian inference using AutoStatSpectra with a conventional method, the LM method plus BIC and multistart fitting, on the same Ni / Al2O3 HAXPES data.
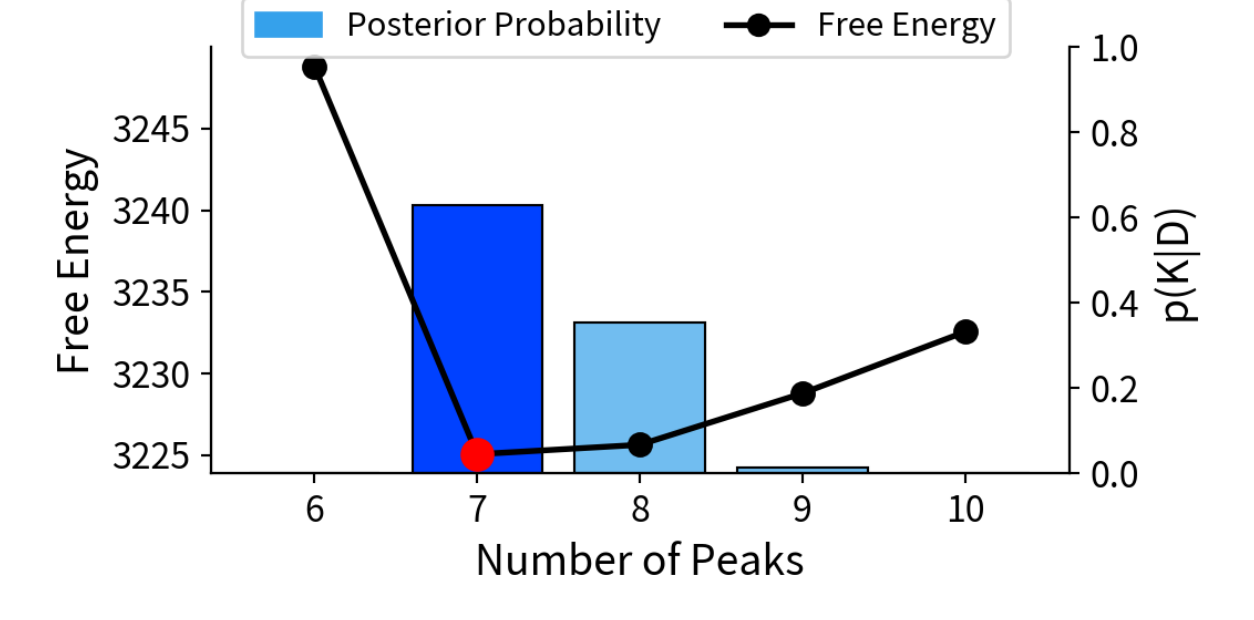
1. Objective Peak Count Determination
Selected K = 7 based on posterior probability.
The conventional method, LM + BIC, overestimated the result as K = 9.
2. Reduced Initial-Value Dependency
Achieved stable fitting by exploring from prior distributions.
The conventional LM method produced failed fits even after eight multistart runs.
3. Quantified Uncertainty
Obtained confidence intervals and standard deviations from parameter posterior distributions.
With the conventional method, evaluating result reliability is difficult.
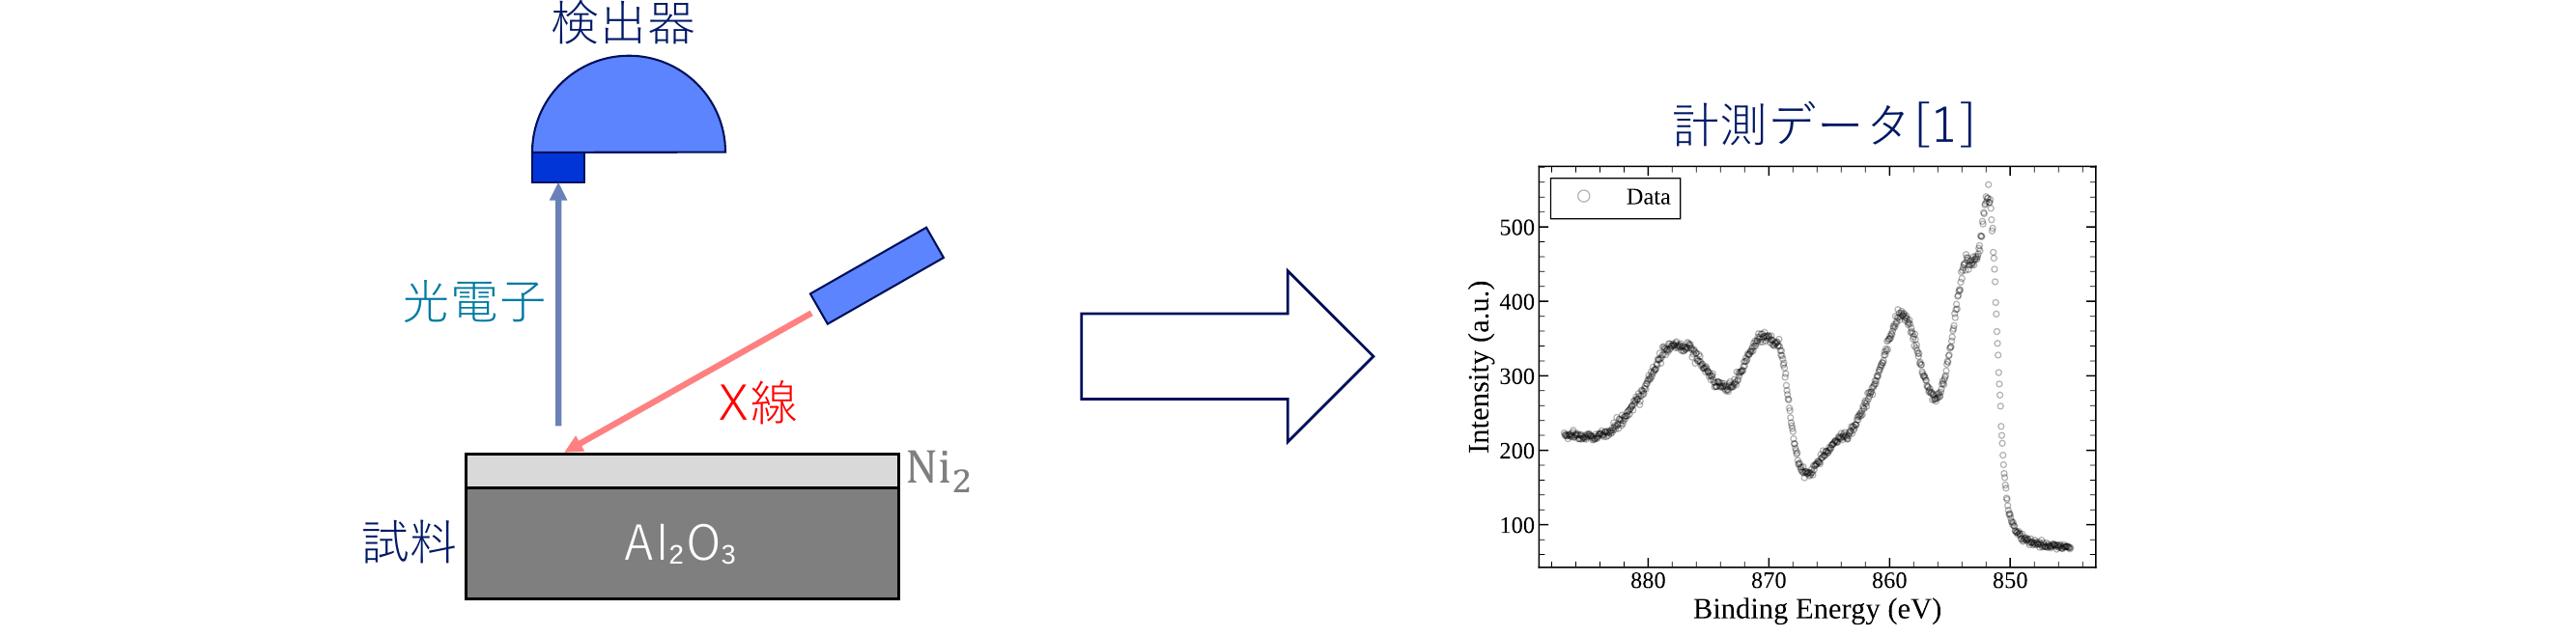
Target Data
We applied Bayesian inference to hard X-ray photoelectron spectroscopy (HAXPES) data for a Ni sample supported on aluminum oxide (Al2O3), estimating both the number of peaks and the model parameters.
- Sample: Ni / Al2O3
- Measurement method: hard X-ray photoelectron spectroscopy (HAXPES)
- Analysis target: Ni 2p region, approximately 850-890 eV
- Data source: public dataset, CC BY 4.0, see below
Our Approach: Bayesian Inference Analysis with AutoStatSpectra
Using a mathematical peak model, Gaussian-Lorentzian mixture plus Shirley background, and a noise model, Poisson approximation plus systematic error, AutoStatSpectra estimates the number of peaks K and model parameters Θ simultaneously through Bayesian inference.
Posterior Probability Estimation for Peak Count
For candidate peak counts K = 6-10, AutoStatSpectra calculates the free energy and determines the most appropriate number of peaks based on posterior probability. In this case, K = 7 received the strongest support with a posterior probability of 63.06%, while uncertainty including K = 8, at 35.39%, was also visualized.
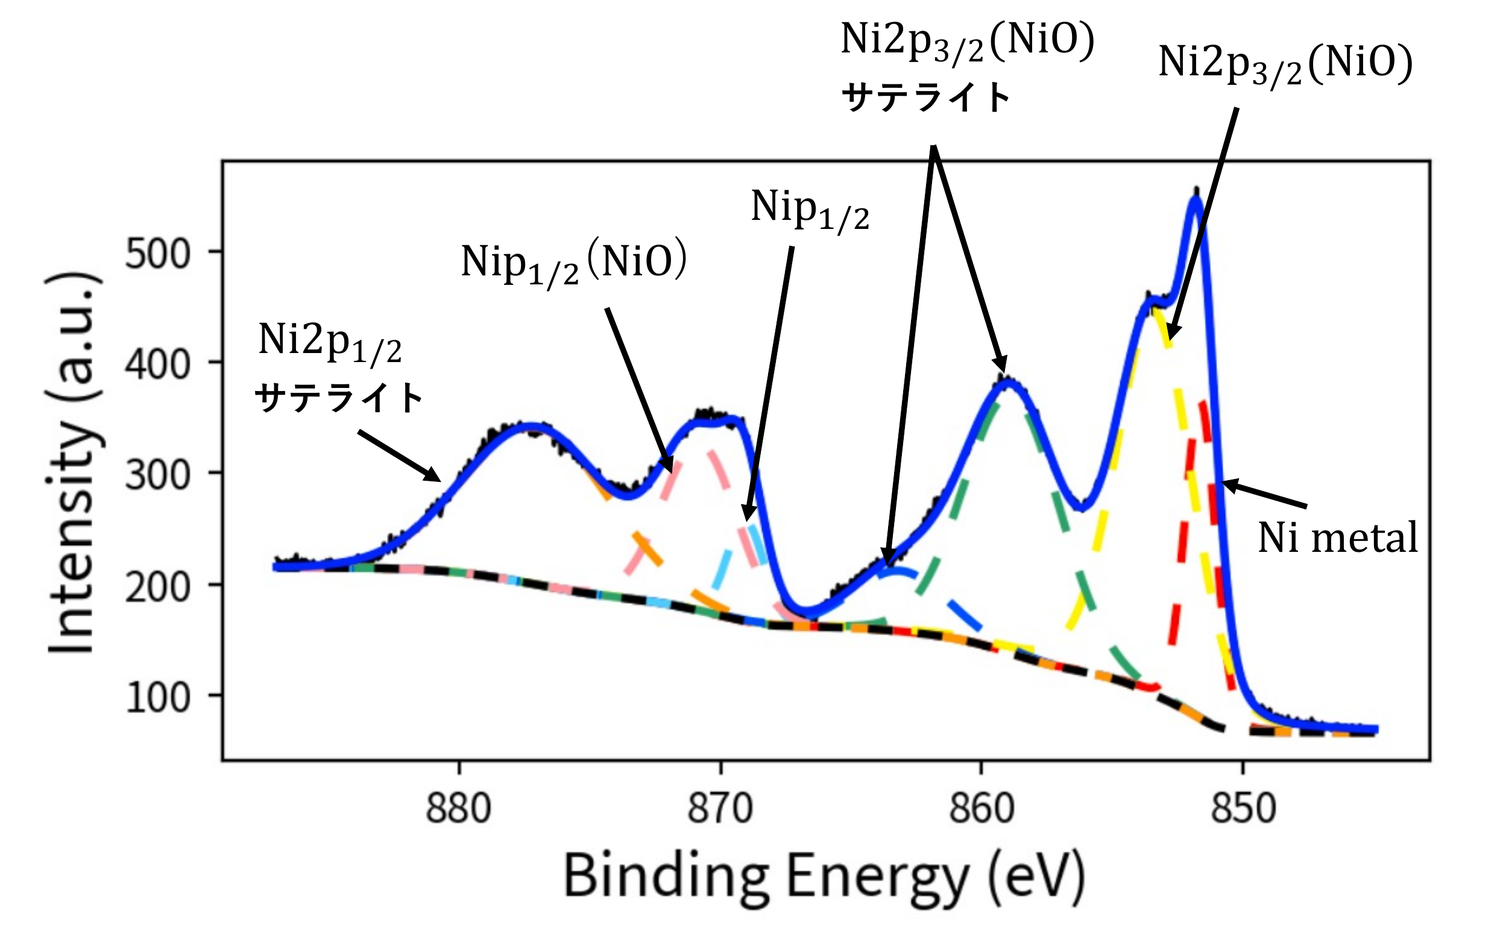
Element and Chemical-State Identification
From the seven estimated peak positions, the analysis identified Ni metal, Ni 2p3/2 (NiO), Ni 2p1/2 (NiO), and their satellite structures.
Information Obtained
- Peak position: element and chemical-state identification
- Peak area: elemental ratio and phase fraction
- Peak width: physical-property information such as conductivity
- Parameter posterior distributions: reliability and uncertainty evaluation
Comparison with the Conventional Method: LM Method + BIC
We applied the Levenberg-Marquardt (LM) method, a common parameter-fitting technique, together with BIC-based peak count selection to the same data and compared the results with our approach.
Overestimated Peak Count and Unstable Fitting
Under the BIC criterion, fitting with the LM method selected K = 9, resulting in a higher peak count than the K = 7 supported by Bayesian inference. The LM method also showed strong initial-value dependency, and even with multistart fitting, eight runs, we observed cases where fitting broke down.
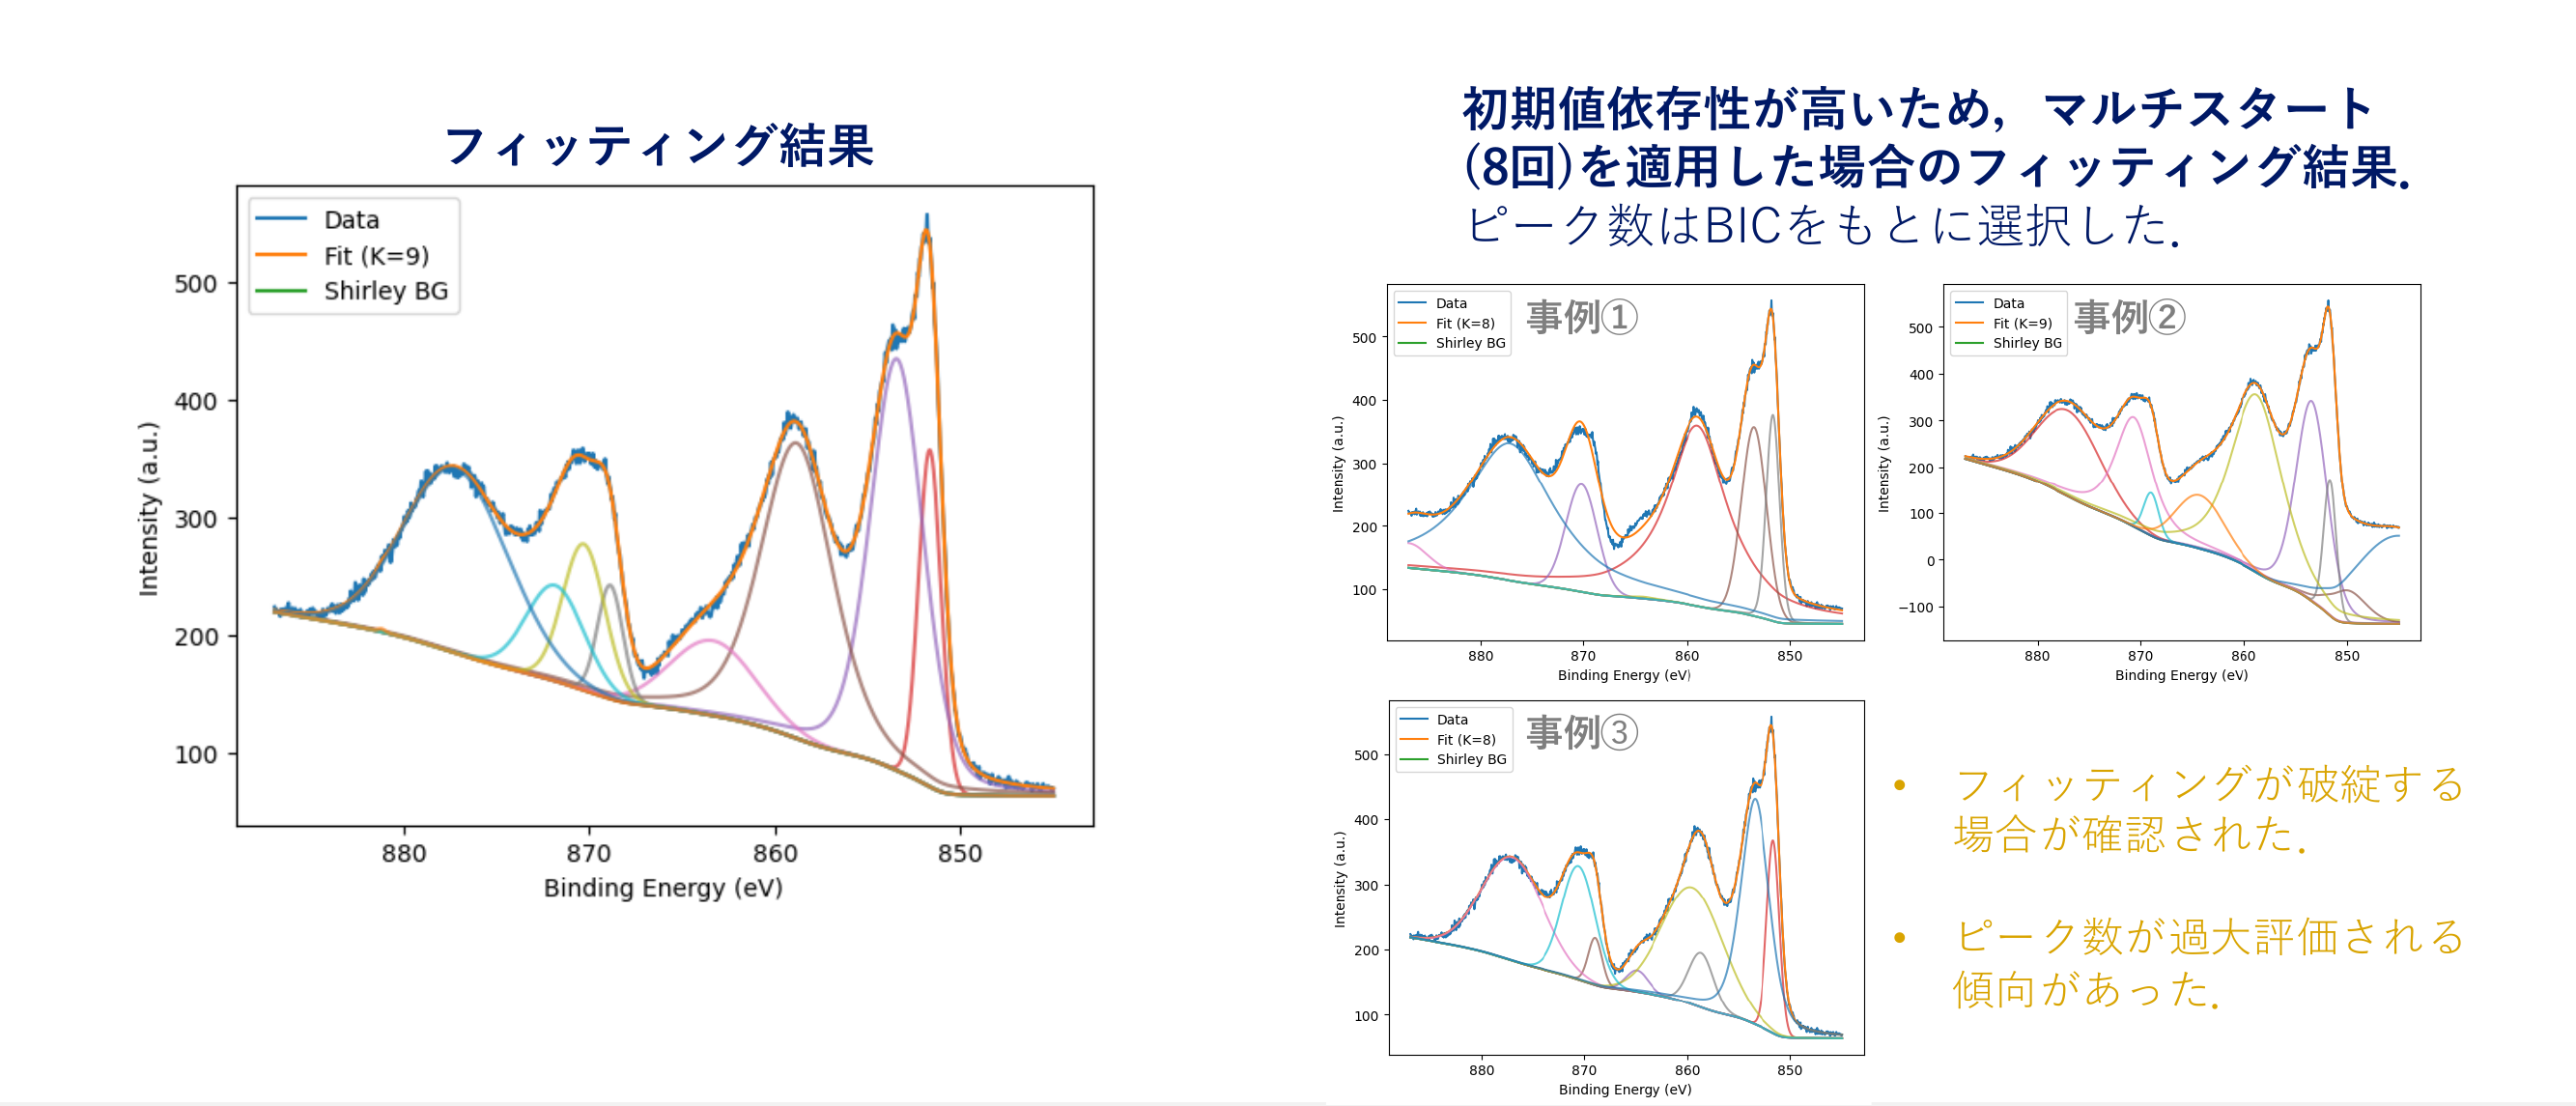
As shown here, the conventional method produced unstable results in both peak count selection and parameter optimization. In contrast, our approach evaluates the number of peaks and peak shapes probabilistically, producing estimates that are easier to interpret.
Conventional Method: LM Method + BIC
- Tends to overestimate the number of peaks, K = 9
- High initial-value dependency, requiring multistart fitting
- Includes cases where fitting breaks down
- Difficult to evaluate result reliability
Our Approach: Bayesian Inference
- Determines the number of peaks based on posterior probability, K = 7
- Low initial-value dependency and stable fitting
- Quantifies uncertainty from parameter posterior distributions
- Reduces reliance on analyst experience
Summary
Conventional analysis methods often overestimate the number of peaks or produce failed fitting results. Even when experienced analysts can manually remove such results for familiar samples, evaluating the reliability of the results remains difficult.
Our approach, Bayesian inference, estimates both peak counts and parameters probabilistically, enabling reproducible analysis that does not depend on analyst experience. By combining fast, convenient conventional methods with Bayesian inference where each is most appropriate, organizations can achieve efficient and reliable spectral analysis.
Contact Us
We propose automated Bayesian inference analysis for XPS, XRD, Raman, and other spectral data.
- Analysis templates tailored to your instruments and data formats
- Parallel validation with your existing analysis process, including PoC
- Automated analysis report generation and integration into on-site operations