
Use Case
Peak Separation of FT-IR Difference Spectra and Estimation of Bonds and Structures [AutoStatSpectra]
Manual fitting of difference spectra is easily swayed by the chosen number of peaks and initial values. Here, models are compared including K=0, the "no peak" model. Whether a peak is present, how overlapping bands should be separated, and which bonds and structures they likely correspond to are all organized with their uncertainty.
The Analysis Challenge in This Case
This case analyzes FT-IR changes that accompany a hydrogenation process at the Si/SiO2 interface. Using Before HF as the reference, we compare difference spectra after HF treatment, after sandwich annealing with an HF-etched wafer as the hydrogen source, and after oxidation. The data mix conditions with and without peaks in the Si-H region, broad bands from the oxide network in the Si-O-Si region, and negative-going aliphatic C-H bands in the C-H region. With data like this, the treatment of peak count, background, negative bands, and the no-peak case tends to depend on manual fitting settings, so we compared models including K=0 with AutoStatSpectra.
Common Challenges in Similar Analyses
- The number of peaks has to be decided in advance
- Fitting may converge to a local solution depending on initial values
- Small peaks are hard to distinguish from background variation
- Explaining "no peak" tends to rely on visual judgment
What AutoStatSpectra Does
- Compares peak counts based on posterior probability
- Evaluates the absence of peaks with the K=0 model
- Estimates background and peaks simultaneously
- Outputs the uncertainty of parameters and model selection
Target Data and Analysis Settings
These FT-IR data were acquired and published by the research team of Landová, Holovský, and colleagues for a study on hydrogenating the Si/SiO2 interface using an HF-etched wafer as a hydrogen source. On this page, we used the public raw FT-IR data VZ3_045_021_CVUT_D_0008_v1.csv, extracted the Si-H, Si-O-Si, and C-H regions from difference spectra referenced to Before HF, and ran four analyses in total.
Data Source
- Dataset: Dataset of "Hydrogenation of Si/SiO2 Interface Using HF-Etched Wafer as a Source of Hydrogen"
- Authors/Creators: Landová, Lucie (Data collector); Holovský, Jakub (Data collector); Bouzek, Karel (Project leader); Paušová, Šárka (Data manager)
- Zenodo DOI: 10.5281/zenodo.18739873
- License: Creative Commons Attribution 4.0 International
- Original paper: Pakki et al., Physica Scripta 101, 075914 (2026), DOI 10.1088/1402-4896/ae4070
AutoStatSpectra Analysis Settings
We used a Gaussian peak function and a linear background model, and evaluated the model for each K based on posterior probability.
- Background: Linear, Peak function: Gaussian
- Noise: Gaussian
- In the C-H region only, the negative bands were sign-inverted for fitting, and the results were interpreted with the original negative sign
Posterior Probability of Peak Count and Fitting Results
Si-H Region: K=1 After HF, K=0 After Oxd
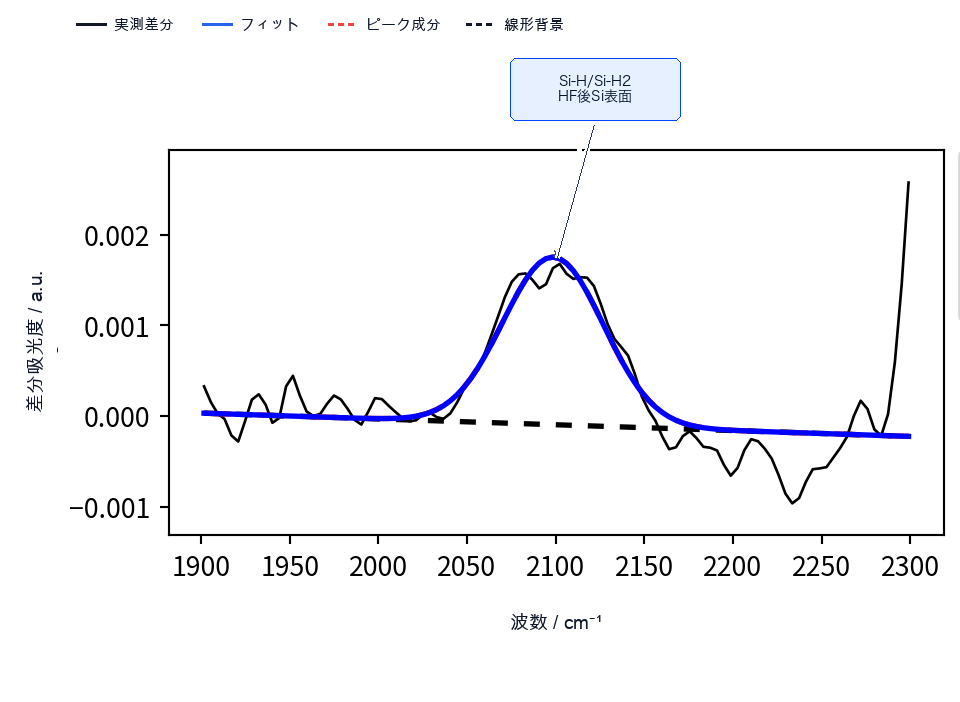
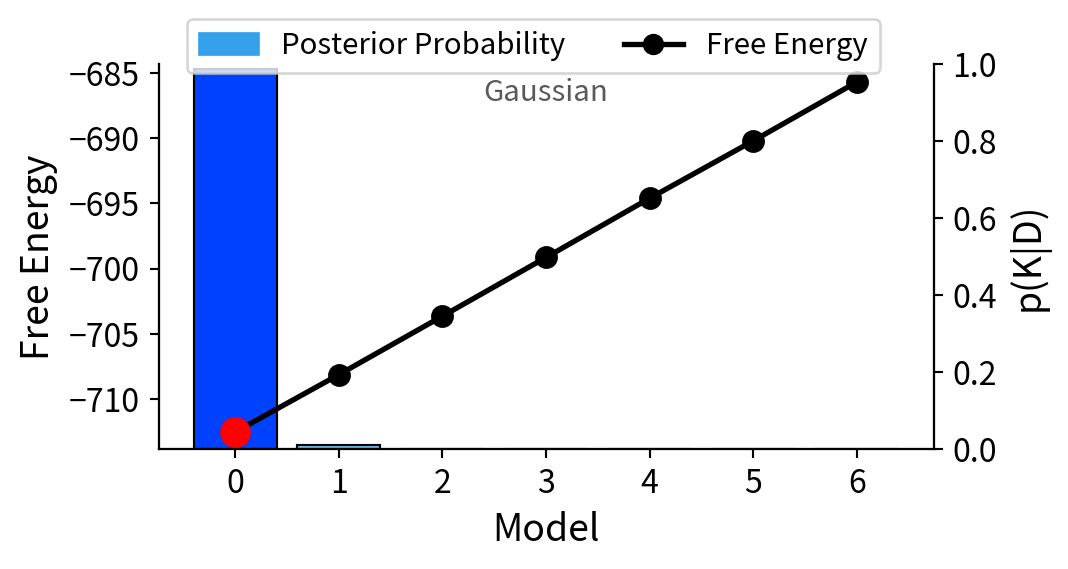
In the Si-H region of After HF - Before HF, K=1 received the strongest support with a posterior probability of 82.0%. The estimated peak position was 2098.51 cm-1, corresponding to Si-H/Si-H2 stretching vibrations from the bare Si surface after HF treatment.
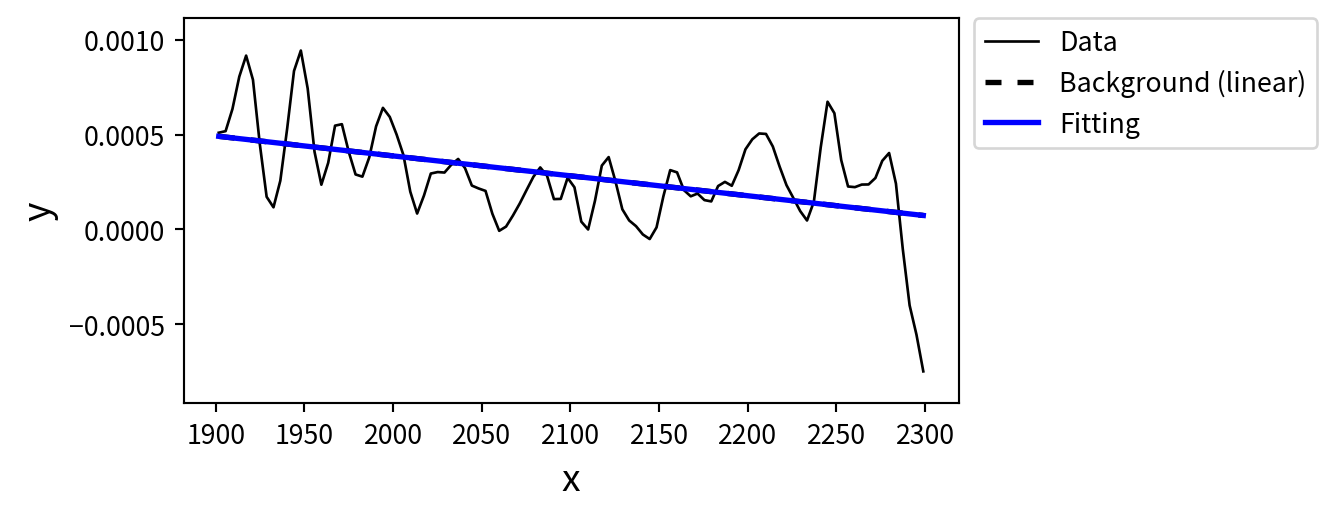
For After Oxd - Before HF, K=0 received the strongest support at 98.9% within the same Si-H search range.
Si-H Region: Estimated Assignment of the Separated Peak
| Estimated peak position | Estimated bond / structure |
|---|---|
| 2098.51 cm-1 | Si-H/Si-H2 stretching, from the bare Si surface after HF treatment |
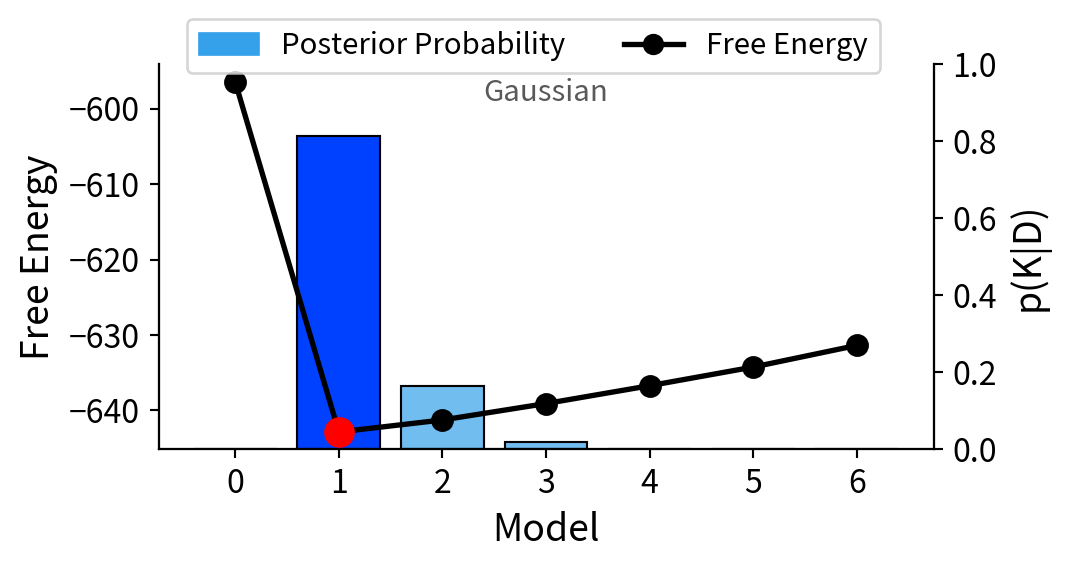
Si-H Region: K=0 Model After Oxd
Si-O-Si Region: Separating Broad Bands and High-Wavenumber Responses
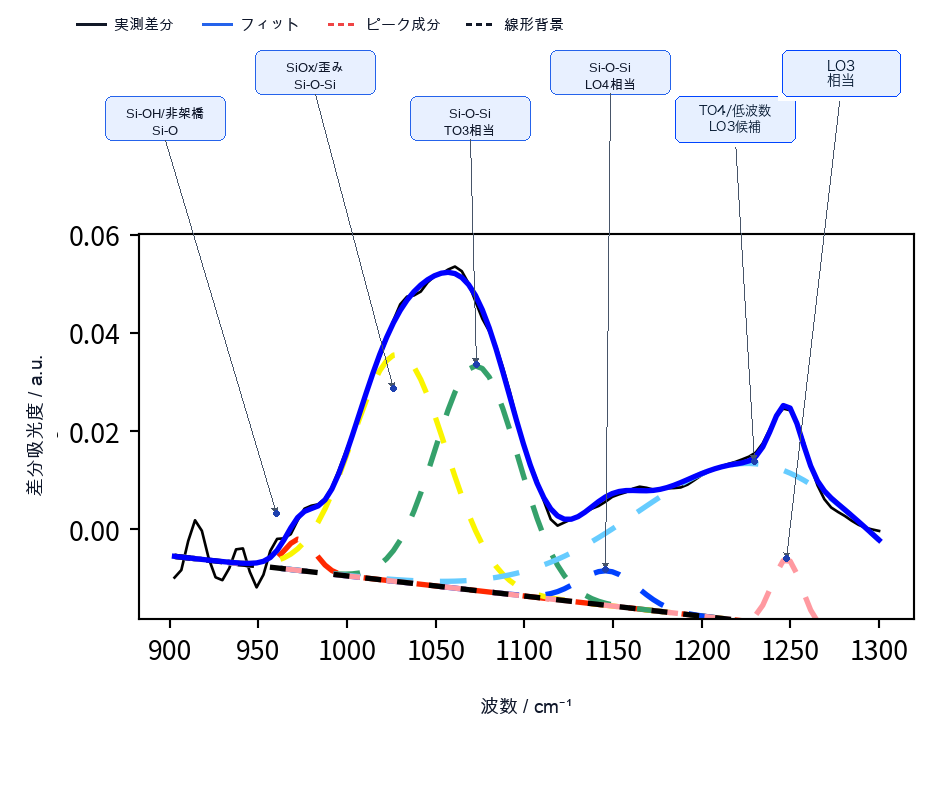
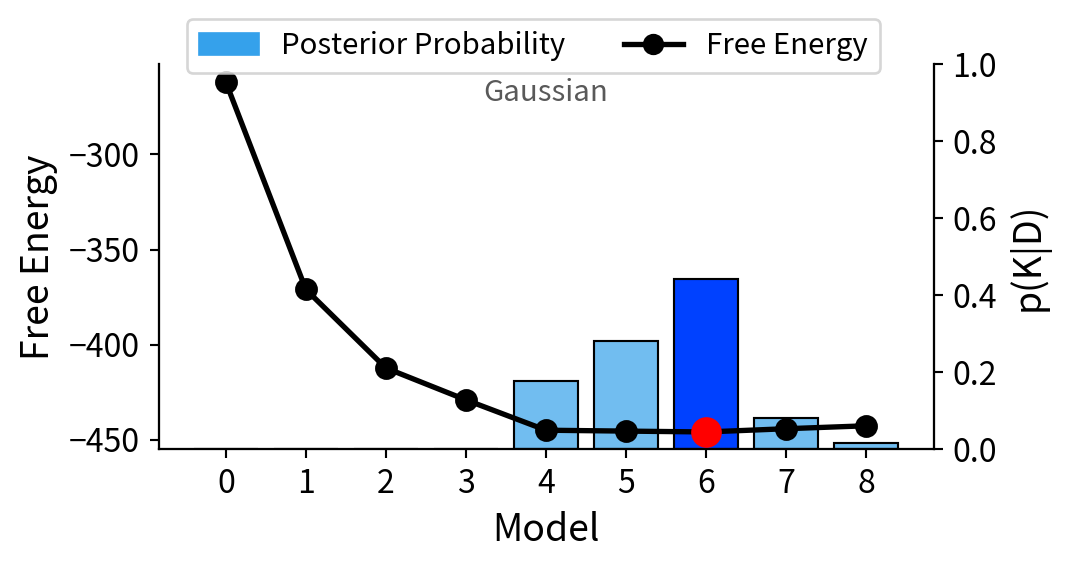
In the Si-O-Si region of After Sandwiching - Before HF, K=6 received the highest posterior probability, and the band was evaluated as six components at 973.15, 1034.25, 1076.50, 1146.82, 1229.90, and 1248.10 cm-1. Because the original data were acquired by FTIR-ATR measurement, the bond and structure assignments also include the TO/LO responses on the high-wavenumber side.
Si-O-Si Region: Estimated Assignments of the Separated Peaks
| Estimated peak position | Estimated bond / structure |
|---|---|
| 973.15 cm-1 | Si-OH / Si-O stretching from chemical oxide |
| 1034.25 cm-1 | SiOx suboxide / red-shifted TO component |
| 1076.50 cm-1 | Si-O-Si asymmetric stretching (TO3) |
| 1146.82 cm-1 | Si-O-Si high-wavenumber response (LO4) |
| 1229.90 cm-1 | Si-O-Si high-wavenumber response (TO4 / red-shifted LO3 candidate) |
| 1248.10 cm-1 | Si-O-Si high-wavenumber response (LO3) |
C-H Region: Evaluating Negative Bands by Sign Inversion
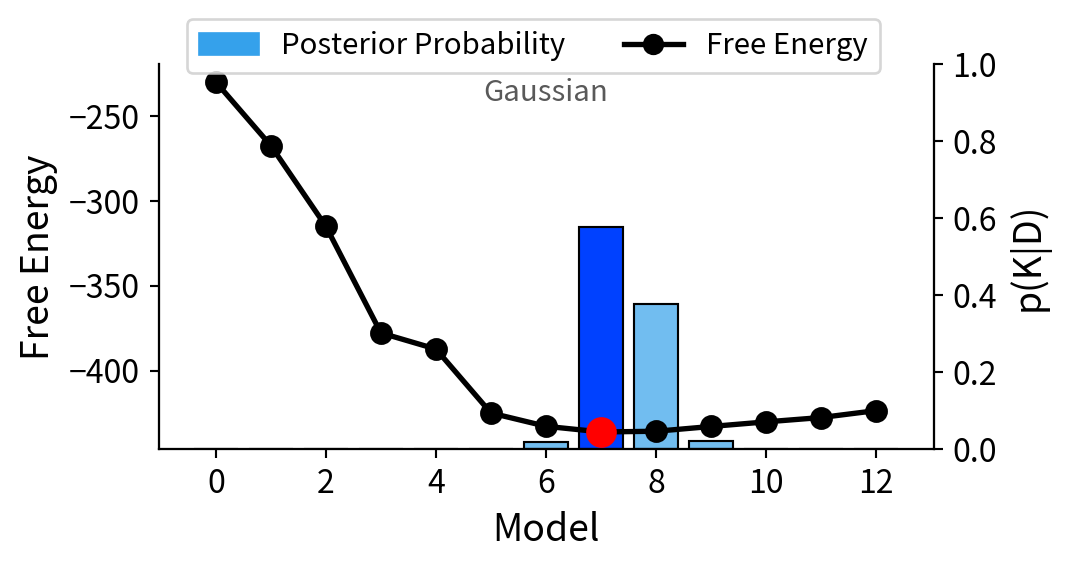
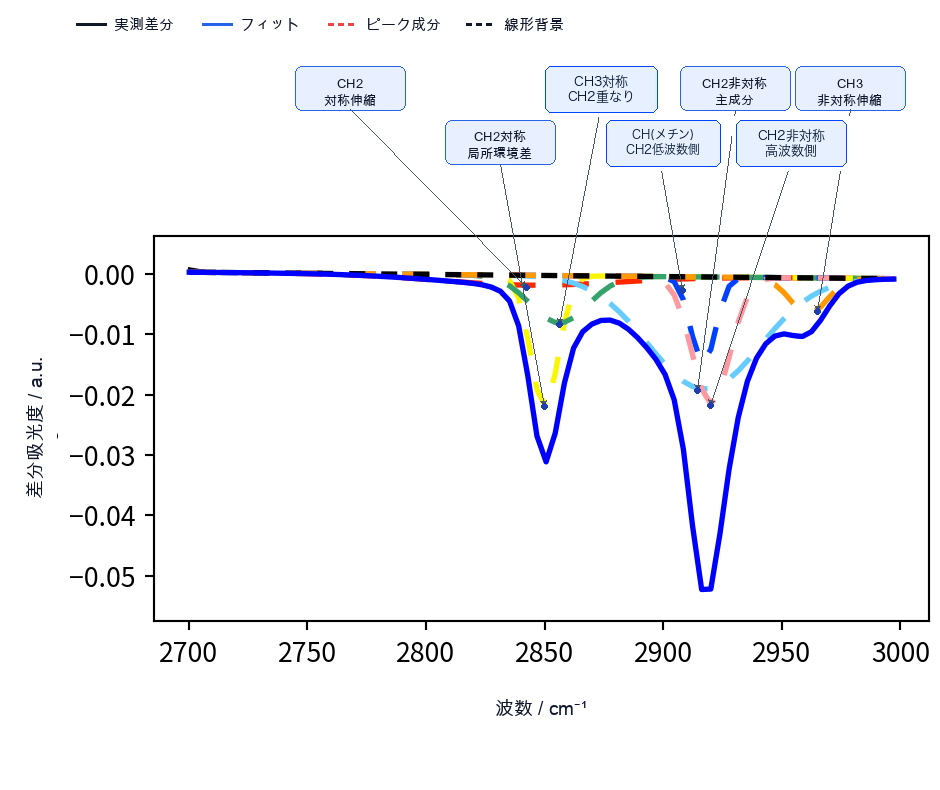
In the C-H region, the dominant feature was a negative difference band, where the absorbance of aliphatic C-H stretching decreased relative to Before HF. This does not indicate that new C-H bonds formed after treatment. We sign-inverted this negative band for fitting, and K=7 received the highest posterior probability. The seven components are not physically separated individual bands; they are overlapping statistical components that represent the band shape of the C-H stretching region, and the bonds and structures in the table below are candidate assignments for each component.
C-H Region: Estimated Assignments of the Separated Peaks
| Estimated peak position | Estimated bond / structure |
|---|---|
| 2849.90 cm-1 | Aliphatic CH2 symmetric stretching |
| 2855.16 cm-1 | Aliphatic CH2 symmetric stretching (different local environment) |
| 2861.67 cm-1 | Overlap of CH3 and CH2 symmetric stretching |
| 2917.33 cm-1 | CH (methine) stretching / low-wavenumber side of CH2 asymmetric stretching |
| 2917.94 cm-1 | Main component of aliphatic CH2 asymmetric stretching |
| 2921.40 cm-1 | High-wavenumber component of aliphatic CH2 asymmetric stretching |
| 2960.85 cm-1 | Aliphatic CH3 asymmetric stretching |
Summary
In this case, we applied AutoStatSpectra to public FT-IR difference spectra to separate overlapping bands, judge peak presence or absence including K=0, and estimate bonds and structures from peak positions.
In the Si-H region, a K=1 peak candidate from the HF-treated Si surface was supported for After HF, and K=0 was supported for After Oxd. In the Si-O-Si and C-H regions, broad bands and negative difference bands were organized as statistical models while checking the uncertainty of the number of components as posterior probabilities.
AutoStatSpectra reduces the training cost, interpretation variability, and analysis workload that often become issues in conventional spectral analysis.
7-Day Free Trial
Try the web app version of AutoStatSpectra for seven days and check the operation and analysis flow before signing a contract.
- Runs in the browser, so no installation is needed for the trial
- After confirming your target data and purpose, we issue a license following a meeting